VERMONT WAS DOING IT BEFORE IT WAS COOL: A HIPSTER Analysis OF PERMITLESS CARRY

Before open-carry TikTok fashion videos were showing stylish ways to brandish your blick, Vermont quietly let folks holster whatever, whenever, without the need of a permission slip.
Vermont lived by the “carry-anything-anywhere” motto solo for decades, but in the last 10 years, a whopping 22 states have stolen their steez.
But did this trigger a change in gun violence?
The United States Concealed Carry Association (USSCA) lists the permitless carry states as follows: Alabama, Alaska, Arizona, Arkansas, Florida, Georgia, Idaho, Indiana, Iowa, Kansas, Kentucky, Louisiana, Maine, Mississippi, Missouri, Montana, Nebraska, New Hampshire, North Dakota, Ohio, Oklahoma, South Carolina, South Dakota, Tennessee, Texas, Utah, Vermont, West Virginia, and Wyoming.
Do states that have identically lax policy around carry share similar levels of gun use in their homicide numbers?
Does regionality matter? Do people use guns to unalive people at similar rates in Maine as they do Texas?
How about the states late to the party? Did removing red tape around carrying have any impact on their gun violence numbers?
Let’s find out.
For the first part, the regional analysis, I will be looking only at “fully unrestricted,” or “no-restriction” constitutional carry states with zero added hoops. That means no extra permits, no extra training required, no preference on the type of carry (open or concealed), and no limitations on firearm type. That nixes:
Florida & North Dakota – still conceal-only (extra hoops to have your gun as a showpiece).
Tennessee – handguns only (you will fail the vibe check carrying long guns).
This leaves our final 26 contestants as: Alabama, Alaska, Arizona, Arkansas, Georgia, Idaho, Indiana, Iowa, Kansas, Kentucky, Louisiana, Maine, Mississippi, Missouri, Montana, Nebraska, New Hampshire, Ohio, Oklahoma, South Carolina, South Dakota, Texas, Utah, Vermont, West Virginia, and Wyoming. Minor age quirks, such as needing to be 21 instead of 18 to carry certain weapons, won’t kick a state off this island.
With our final contestants assembled, standing shoulder to shoulder - obviously not too close because they’re all packing, we can continue to getting our data. We’ll utilize the FBI’s Crime Data Explorer tool, setting the time frame to 10 years and going through state by state to create a comparison of those entisingly gory numbers. From there, we’ll be able to see just how popular firearms were as the weapon of choice for homicidal Americans and test if similar laws mean similar rates and if the region of a state has any impact on its pew-pew levels.
For the second part of this analysis, we’ll take a slice of states that jumped on the bandwagon approximately halfway between 2009 - 2019 (don’t get mad at me, the time-series data we need for this part only goes up to 2019 from the FBI’s Uniform Crime Reporting database, at the time of this writing) to see if their gun homicide rates increased or decreased after joining the fully permitless club.
These analyses won’t tell us everything, but they should give a decent snapshot into how permitless carry holds up across different states.
THE METHOD (Part 1)
Using ten years of FBI Crime Data Explorer figures and a brutal amount of spreadsheet gymnastics, I compared homicide weapon choice in all 26 fully unrestricted states with the national baseline.
This part took a while, but it wasn’t all that hard. Set the selected crime to ‘Homicide,’ then set the location to ‘United States,’ and lastly, set the time frame to ‘10 Years.’ Then, scroll down to where it says ‘Type Of Weapon Involved By Offense’ and click on ‘Show More.’ From here, simply tally up all the weapon types that would be considered a gun or firearm and put that over the total homicides. The average layperson would consider all of these a gun or firearm: Handgun, Firearm (likely cases where the specific type wasn't identified), Rifle, Other Firearm, Handgun (Automatic), Shotgun, Firearm (Automatic), Rifle (Automatic), Other Firearm (Automatic), and Shotgun (Automatic).
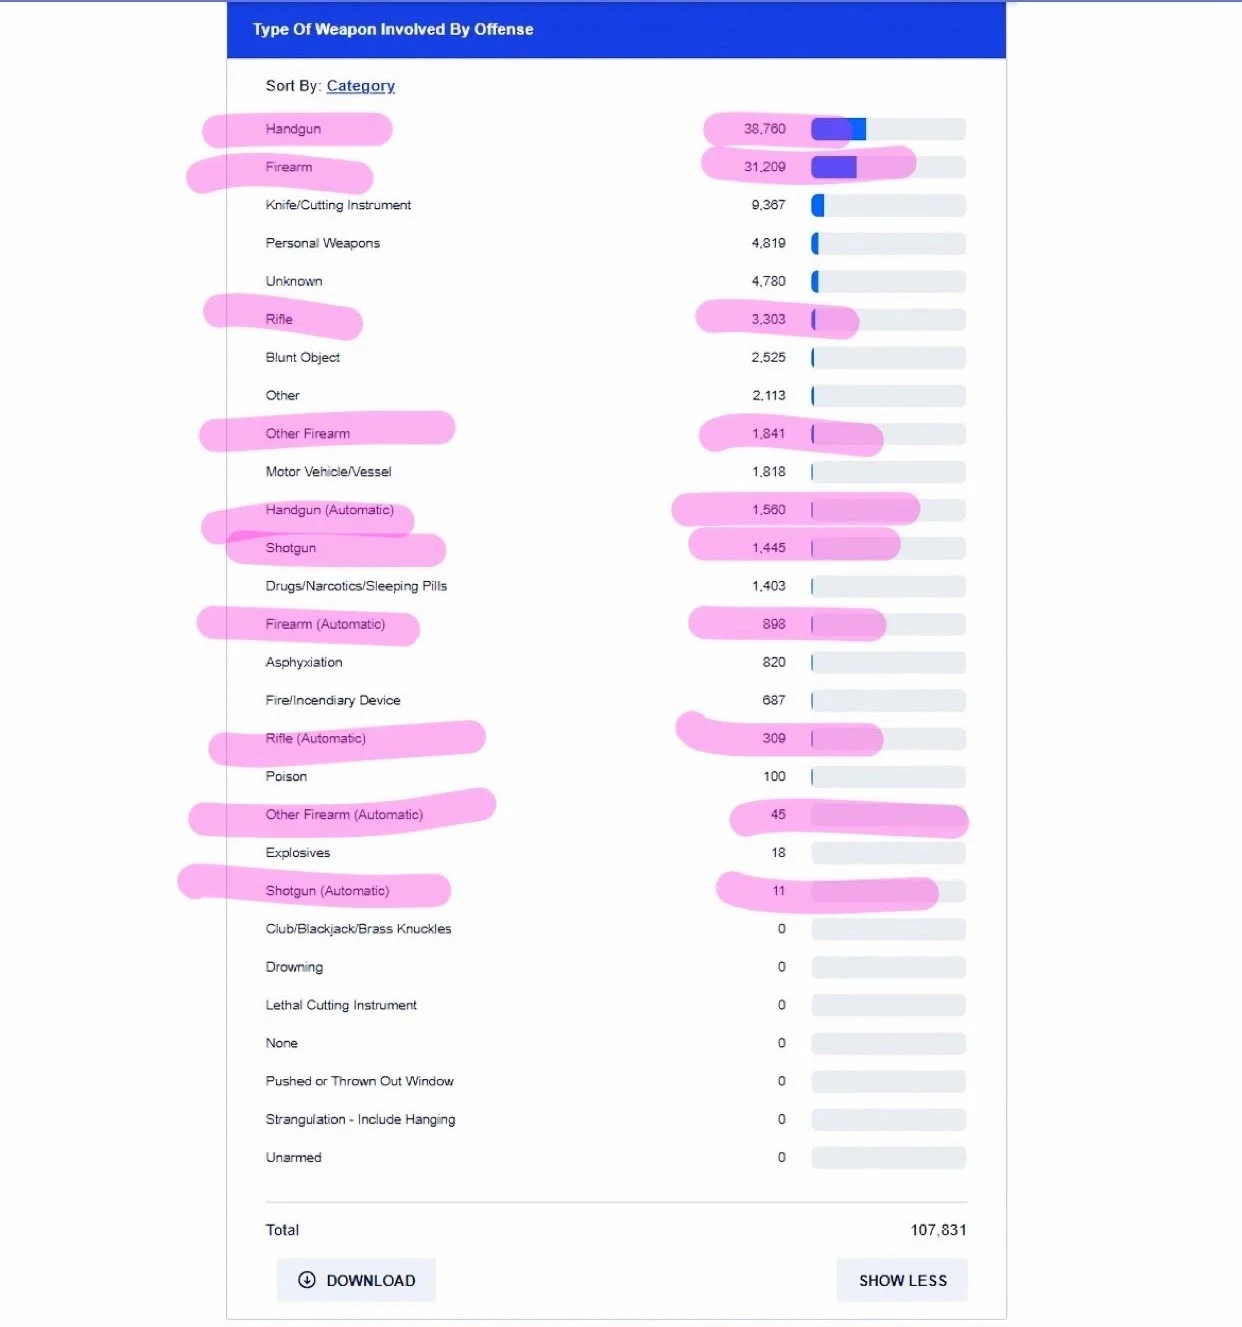
The United States had 10,7831 recorded homicides in the past 10 years, of which 7,9381 were perpetrated with some form of firearm.
This results in a firearm utilization rate of 73.6% for the country.
Clicking the ‘Download’ button will put this info into a .CSV file that can be opened with Excel and now that we have the benchmark for the country as a whole, just repeat this step for our 26 contestant states, copying and pasting the tables, until you have all the data on a single sheet.
What’s that? You don’t feel like it? 🙄
Okay, fine, here’s an Excel file that conveniently has this done. You’re welcome. I also took the liberty of sorting all the contestant states by region and running a couple tests.
Looks Can Be Deceiving
A one-way ANOVA test confirmed that regional differences are statistically significant. Region explains approximately 51% of the variance in firearm usage rates. Pretty huge. However, this also means nearly half the variation occurs within regions, suggesting that state-level cultural, economic, and demographic factors matter as much as whether you live in the Northeast, Midwest, South, or West. Even under identical legal frameworks, neighboring states can diverge by 30+ percentage points.
The other shocker? The mean rate of the 26 unrestricted states observed was 65.4%, below the national average of 73.6%. Only 10 of 26 states exceed the U.S. baseline, the rest were at or below it.
Permitless carry ≠ automatic gun-violence spike. But also ≠ magical safety. A 38.4-percentage-point spread between states with identical laws can only mean one thing: there’s more at play than what meets the eye.
Two things stick out to me right away. One: Ohio actually exists! (and it’s the representative sample, basically falling right on the 73% firearm usage rate mirrored by the nation). So if you want a personal exposure to gun violence that’s, uhhh, authentic? Ohio’s the place for you. Two: states clustered closer to states of the same region than they did states from other regions, with the exception of the Midwest, its states were all over the place.
Oh, and before you get mad at me about which states are included in which region, I’m going off how the U.S. Census Bureau categorizes them, so take it up with them. Some other notes:
The High-Firearm States (Top 5)
Missouri: 83.4% (Midwest outlier)
South Carolina: 81.2%
Georgia: 80.9%
Alabama: 77.8%
Mississippi: 77.7%
All Southern except Missouri. All above 77%.
The Low-Firearm States (Bottom 5)
South Dakota: 45.0% (the floor)
Wyoming: 48.6%
Montana: 49.2%
New Hampshire: 50.0%
Alaska: 54.0%
Mostly Mountain West and Northern. All below 55%.
Gun Culture Matters
South: 74.2% (highest average)
Midwest: 66.0% (widest variation—SD at 45%, MO at 83%)
West: 55.8%
Northeast: 53.9% (lowest average)
ANOVA result: Region explains 50.7% of variance but nearly half the variation occurs within regions. Translation: The state you choose to live in matters but the states around your state matter too.
The Method (Part 2)
For this next part, I want us to take a closer look at some of the bandwagoners. The states of Kansas, Maine, Idaho, Mississippi, and West Virginia adopted unrestricted policy relatively recently, with Kansas and Maine going permitless in 2015 and Idaho, Mississippi, and West Virginia going permitless in 2016. Because these states changed policy near the middle of the 11-year span (2009-2019) we’ll use them because we get a few years before and after the change to get a snapshot of any differences. Earlier adopters like Wyoming (2011) or Arizona (2010) would have given us 8-9 post-years but only 1-2 pre-years, making it hard to establish a baseline. Later adopters like Kentucky (2019) would have zero post-adoption years with this dataset.
Like in the last analysis, I went ahead and aggregated each year’s tables into a single file in case you wanted to follow along. Note that the second sheet in the workbook contains the pre/post numbers and gun use ratios.
No Smoking Gun
Of our ‘snapshot’ states, 2 decreased, 2 increased significantly, 1 increased marginally... but no universal patterns emerged.
What’s more, there's a concerning amount of volatility. Idaho swung from 22.7% usage in 2009 all the way up to 57% usage the following year. Similarly, West Virginia halved to 25.8% in 2014, down from the 55.6% the year before, only to double to 52.8% in 2015 right as it decided to ditch concealed carry permits. Year-to-year variation often exceeded the pre/post policy difference meaning any “policy signals" are getting drowned out in the noise of other factors like economic shifts, opioid epidemics, local policing changes, and ordinary volatility, just to name a few.
Unfortunately, this is one of those times where the best conclusion is that we can’t jump to any. There doesn’t seem to be an obvious link between concealed carry policy and gun deaths.
Permits or not, gun culture is more than legal fine print, it's vibes, it’s economics, it’s who tells the better campfire story. Vermont may have been first, but the copycats didn’t automatically absorb its relative low rate of gun murders by following in its footsteps.
The Quantified Conclusion
Okay, so I didn’t uncover a silver bullet solution to solve gun violence. Shocker! I really expected more of myself. However, I do feel like I learned something and even challenged some of my own assumptions. Concealed carry may not be the magical Jenga block that brings down (or builds up) gun crime but that doesn’t mean the insights gained from looking at it, such as about regional differences, volatility, and popular adoption, don’t have implications. Here are some takeaways I got from my background research on this topic:
Accept the Messy Reality: Stop pretending one policy lever controls outcomes. This is where I was most challenged and where I need to broaden my understanding of the problem. The reality is if gun violence was conveniently tied to one or two specific policies, we likely would have found them already. Gun harm is cultural, economic, regional, and legal. Solutions need to be just as multifaceted.
Universal Background Checks: Pitch them as civic duty, not government snooping. Close private-sale loopholes at the federal level for uniform enforcement. Don’t let propaganda fool you, Post et al. (2020) found in a policy study that basic and universal background checks continue to be one of the least controversial gun safety precautions in the eyes of most Americans, when polled.
Extreme-Risk (“Red-Flag") Orders: Data from the National Institute of Justice shows they prevent suicides and mass shootings when properly implemented with due-process protections. Many, many times, in the event of a mass shooting it is not uncommon for the perpetrator to have been at least on the periphery of law enforcement’s radar, yet law enforcement is often unable to meaningfully intervene until something terrible has happened or been explicitly threatened. Finding a way for law enforcement to act when they get credible intel, without stepping on the toes of due process is a modern Rubic’s cube for America’s lawyers.
Gun Culture Cultural Exchange: The fact that regions generally tend to cluster together means there is more that different pockets of American gun culture could be learning from each other. Why has the Northeast and certain Western states like Wyoming and Montana had such low firearms usage rates in their murders, historically, despite being some of the earliest adopters of no-restriction carry? Is it hunting culture? Perhaps these populations are introduced to gun safety at an earlier age? Maybe guns are seen as a lifestyle utility in some places but a self-defense tool in others?—as a study by Boine et al. (2020) suggests.
Shift the Narrative: Change the story from “gun-grabbers vs patriots" to “defective consumer product too good at hospitalizing people"—Teret & Culross's paper around product-safety framing (particularly, wanting guns designed to be more difficult for children and teens to discharge) broadens the net of people invested in gun safety without triggering constitutional anxieties. Nobody gets mad at safety scissors for making it harder to cut yourself. Nobody thinks it’s unreasonable for next year’s car to have more safety features than last year’s model. It might be time to think of firearms in a similar way.
Policy matters, but it's just one ingredient in the complex stew of regional norms, economic conditions, enforcement priorities, and historical baggage. Trying to find a singular cause or solution to gun violence may be doing a disservice to the kind of problem it really is, but solutions are worth thinking about. Hopefully, this has gotten your gears going as to the types of patterns that may exist in the places we aren’t yet looking.
Note: This analysis was conducted using Microsoft Excel for statistical calculations (descriptive statistics, one-way ANOVA) and Chart.js for interactive visualizations. Firearm homicide data was sourced from the FBI Uniform Crime Reporting (UCR) database (2009-2019 state-level weapons tables) and the FBI Crime Data Explorer (2015-2024 ten-year aggregates). The study examined 26 fully unrestricted constitutional carry states with no additional permit, training, or weapon-type requirements beyond federal age minimums. All data sources, Excel workbooks with visible formulas, and visualization code are linked throughout the article for reproducibility.